Last Call: A New Chart Shows Us The Big Fast Food Picture
If you're a visual learner like I am and are not yet familiar with Visual Capitalist, get ready to spend the next few hours glued to your screen, because you are about to learn about so much crap. Want to get a basic overview of the consolidation of the dairy industry? There's an infographic for that. Want a comprehensive overview of the world's money and markets? You got it. Wondering exactly how big Amazon is? Hold onto your hats, because this one's a doozy!
Charts, infographics, and other visual elements are a fantastic way to package comprehensible data, which you can then put to use as you're arguing with your racist uncle on Facebook. And in the event all this information gets to be a bit too much for you, Visual Capitalist can help bring you back from the brink of insanity, too.
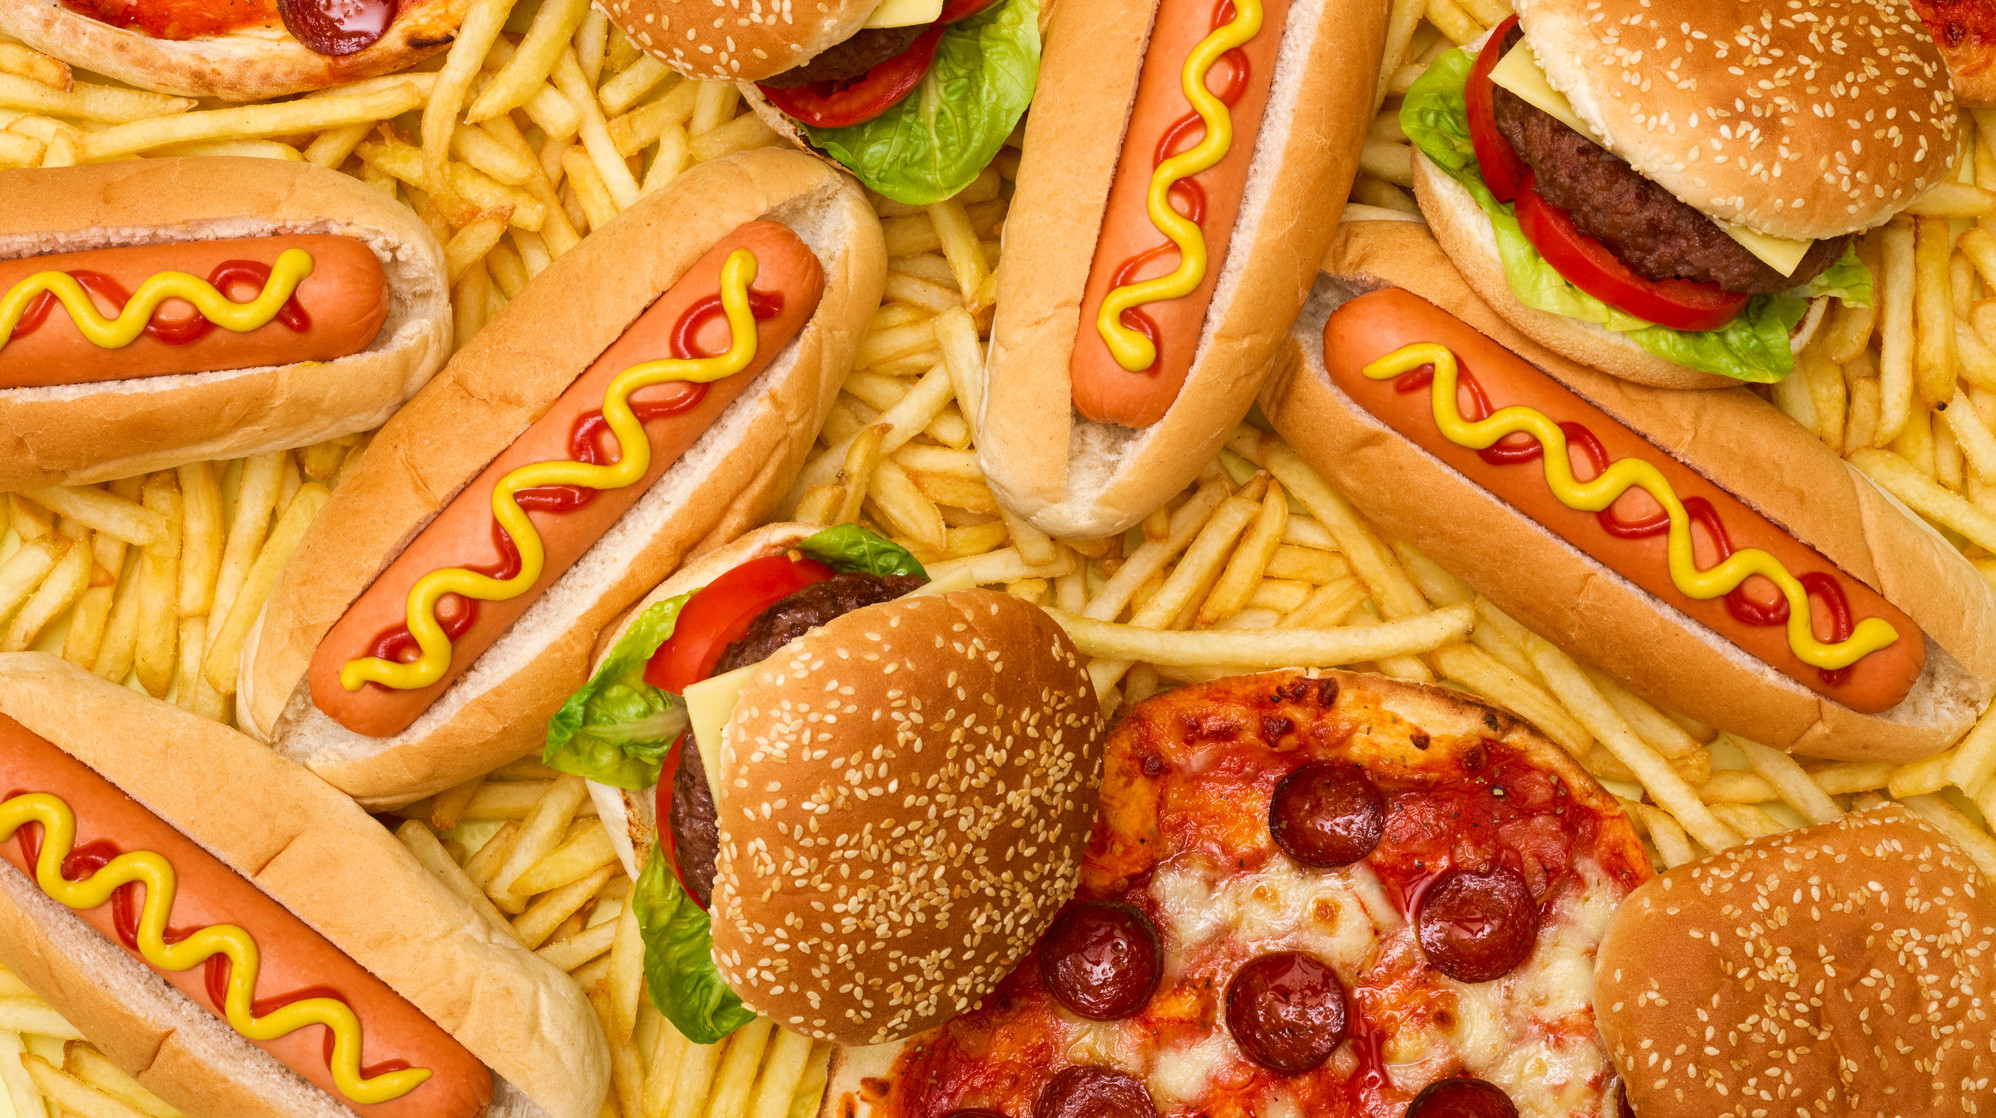
Yesterday Visual Capitalist put out a tastier set of infographics than usual, with a ranking of the 50 most popular fast food chains. Some of the information isn't all that surprising (spoiler alert: McDonald's is number one), but when the data is arranged on a vividly colored pizza-pie chart, it becomes much easier to process the big picture and see how some of our favorite brands stack up against each other. The most shocking thing I gleaned from it is that, of the five major fast food categories, the least popular is pizza. Pizza! In 2019, more money was spent on Starbucks than pizza, and McDonald's sales were nearly double (!!!) that of the entire pizza market. I'm still not sure how this is possible, but pie charts don't lie.
Are there any parts of this greasy, high-sodium infographic that you find to be particularly interesting? What other fascinating things have you discovered by perusing Visual Capitalist?